Google Survey Forms
Language Objective: Ask questions that can be converted into numerical data
Content Objective: Create a spreadsheet and easy to manage Data Table from results of a survey collection
When you are all done with your data processing you should have a sweet looking graph and data table that look something like these:
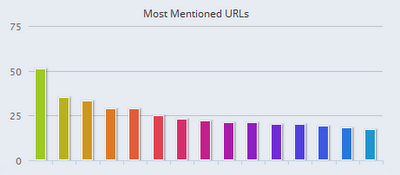
|
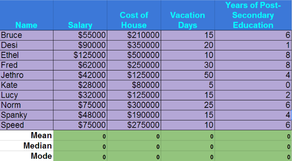
|
Watch some Video Clips below that will HELP you Learn about Organizing data and Graphing your Data:
- Formatting Cells in SpreadsheetURL
Make your Data Table Look Nice! - Sorting Data in your SpreadsheetURL
Let's get organized - Using Functions to Calculate SUMS in your SpreadsheetURL
- Why use a calculator to add data, when the spreadsheet can do the work for you?
- Using the functions to calculate AVERAGE/Mean in your SpreadsheetURL
This is so much easier than the old way! - Finding the Median and Mode in a Spreadsheet
Quick and Easy like Pi - Creating a Pie Chart in a Google Spreadsheet
These pie charts are so yummy, it makes you want to eat them! - Creating a Bar Graph in your spreadsheet
Single Bar and Double Bar Charts - Data & Graphs Rubric
(7th and 8th Graders Start Here)
Take My Survey - Click Here
(Sixth Graders CLICK HERE for your SPREADSHEET!)
Take My Survey - Click Here
- Using Google Forms to collect survey dataPage
After opening your googledocs and creating your survey form( with at least 5-10 technology based questions), then embed the form in the next link and ask 15 - 20 students to take your survey! Once your survey is completed, you can analyze, sort, and graph the data.
(Sixth Graders CLICK HERE for your SPREADSHEET!)
